
March 2026 Market Update
La Plata County Real Estate Market Update
March 2026: What Buyers and Sellers Need to Know
The La Plata County real estate market in March 2026 is shifting—and both buyers and sellers are feeling it. This report primarily reflects March 2026 data, which serves as a strong indicator of early Q1 trends across La Plata County.
A historically mild winter, combined with mortgage rates stabilizing near approximately 6.5%, accelerated both buyer activity and listing inventory. What we saw was a spring market arriving weeks ahead of schedule, with momentum building as early as February.
A Market in Transition:
More Inventory, More Opportunity
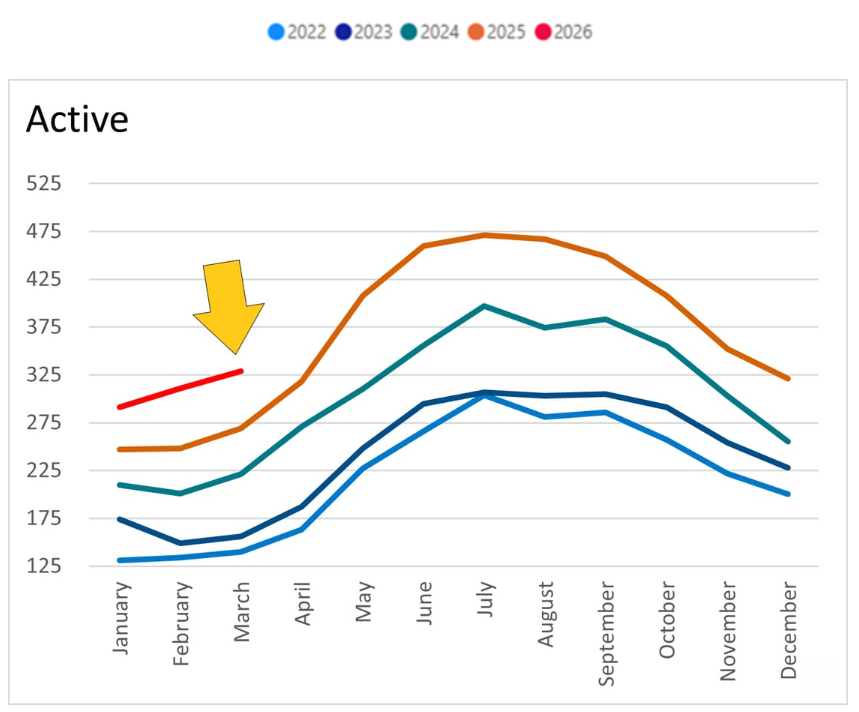
March 2026 was defined by a meaningful shift in inventory.
Active listings rose approximately 22% year-over-year, bringing total inventory to 330 homes
This increase pushed the market to a 4.5-month supply, up over 21% from last year. A healthy market is typically 5 to 6 months.
What does that mean? It means we are entering a market where strategy matters more than speed.
We are shifting toward more balanced conditions, though still slightly favoring sellers; where buyers have more options, and sellers need to be more strategic.
Pricing Trends: Stability with Selectivity
Despite increased inventory, pricing remains resilient.
Single Family Homes
Median Price: $940,000 (↑ 15.7% YoY) Durango In-Town
Median Price: $707,750 (↑ 11.5% YoY) in La Plata County
The gap between average and median price suggests higher-end sales are influencing overall averages.
Condos & Townhomes
Sales Q1: 34 (↑ 61.9% YoY)
Median Price: $547,500 (↑ 7.6% YoY)
This shift may reflect a change in Buyers purchasing what they can afford in order to stay in the area.
This tells us:
• Single-family homes continue to hold value
• Buyers are choosing to purchase what they can afford
Price growth is still present and it’s more measured.
Supply Is Rising Quickly
Inventory growth is one of the most important stories this month—and a key indicator of early Q1 trends.
Active Listings: 329 homes (↑ 22.3% YoY)
Month-over-month increase: +5.8%
At the same time:
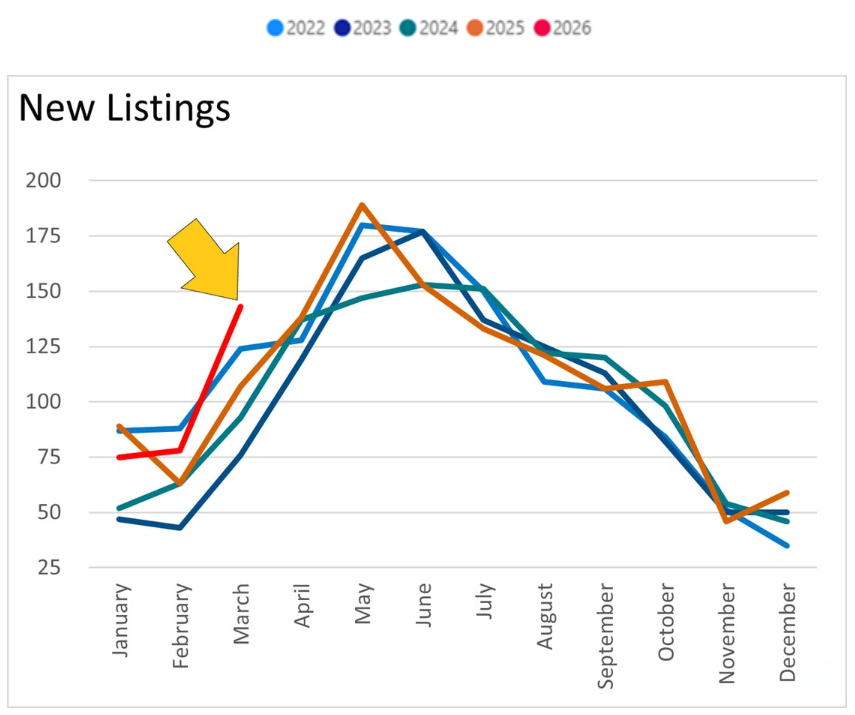
New Listings: 143 homes (↑ 33.6% YoY)
Month-over-month surge: +83.3%
This increase is typical for early spring, as buyer activity ramps up from slower winter months.
The takeaway: More sellers are entering the market and earlier than usual.
Demand Is Keeping Pace
Even with rising inventory, buyer demand remains strong.
Pending Sales: 85 homes (↑ 18.1% YoY)
This indicates:
• Buyers are active
• Demand has not disappeared
• Well-positioned homes are still moving

Closed Sales: Activity Is Increasing
While inventory is rising, closed sales data confirms that the market is still moving forward—not slowing down. This reflects continued buyer follow-through from contracts written earlier in the quarter.
March 2026 saw 61 closed sales (44 Single family and 17 Townhouse/Condo in La Plata County) compared to 45 in March 2025
Year-to-date (January–March) in La Plata County Single Family homes:
105 total sales in 2026 vs. 95 in 2025
(↑ 10.5% year-over-year)
What This Means
Even as more homes come to market, buyers are continuing to move forward with purchases.
This tells us:
• Demand is still present
• Transactions are increasing—not declining
• The market is expanding, not contracting
Buyer Behavior: More Balanced, More Thoughtful
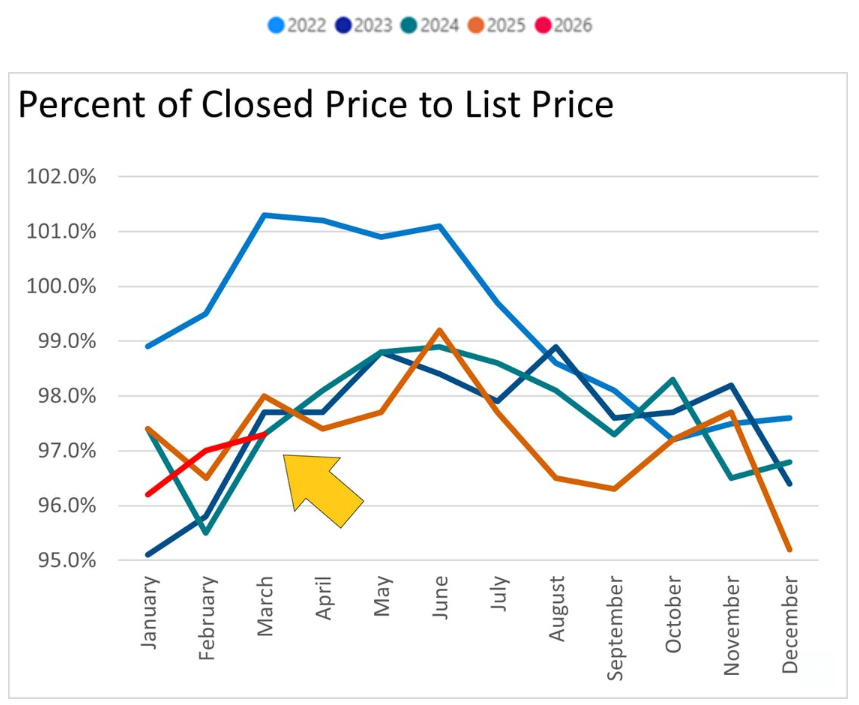
One of the clearest indicators of a shifting market is the list-to-sale price ratio.
Closed Price to List Price: 97.3% (↓ 0.7% YoY)
While slightly down year-over-year, this still reflects a strong pricing environment overall.
Buyers are still active—but they are no longer willing to overpay without clear value relative to current competition.
They are:
• Comparing options
• Negotiating more
• Prioritizing condition and value
Southwest Colorado Reality Check
When you look at La Plata County as a whole, you see strong appreciation and shifting demand patterns.
When you narrow the lens to Durango and Bayfield, you see a more stabilized, nuanced market where pricing, competition, and buyer behavior require a more strategic approach.
Both are true. The key is understanding which data set applies to your property.
It is a collection of micro-markets, including:
• In-town Durango
• Durango rural
• Bayfield (in-town and rural)
• Ignacio and surrounding areas
• Mountain and acreage properties
Each behaves differently.
For example:
Durango in-town continues to see strong pricing and reduced days on market
Rural properties are seeing increased inventory and longer timelines
Bayfield markets show mixed signals depending on property type
These patterns can vary significantly by price point and property type within each area.
Understanding these differences is where strategy matters most.
3 Steps for Clarity and Confidence
Whether you’re buying or selling, here’s how to navigate this market:
1. Understand Your Micro-Market
Your neighborhood matters more than national trends.
2. Watch Inventory Closely
More listings mean more competition—and more opportunity.
3. Build a Strategy, Not a Guess
Success in this market comes from positioning, not assumptions.
What This Means for Sellers
• Strategic pricing matters more than ever
• Preparation is critical
• The first 7–10 days on market are key
Well-prepared, well-priced homes are still seeing strong activity.
What This Means for Buyers
• You have more options than last year
• Negotiation opportunities are increasing
• Timing matters, but so does preparation
This is one of the first windows in years where buyers have both opportunity and leverage.
Preparation, not just timing, is what creates opportunity in this market.
The Bottom Line
March 2026 marks a transition toward a more balanced market.
Not a slowdown.
Not a surge.
A shift.
And in markets like Southwest Colorado, those shifts create opportunity—for both buyers and sellers who are prepared.
Frequently Asked Questions About the La Plata County Real Estate Market
Is the La Plata County real estate market slowing down in 2026?
The market is not slowing down—it’s shifting. Inventory is increasing, giving buyers more options, while demand remains steady. Homes are still selling, but buyers are more selective and taking more time to make decisions.
Is now a good time to sell a home in Durango, Colorado?
Yes, but strategy matters more than ever. Homes that are well-priced and properly prepared are still seeing strong activity. Buyers are more thoughtful, so positioning your home correctly is key to a successful sale.
Are home prices dropping in La Plata County?
Home prices have remained relatively stable, especially for single-family homes. While some segments like condos may see more variability, overall pricing continues to show resilience in the Southwest Colorado market.
Why are there more homes for sale in Durango right now?
Inventory has increased due to an earlier spring market, driven by a mild winter and more stable mortgage rates. Many sellers chose to list earlier than usual, creating more options for buyers.
Are buyers still active in Southwest Colorado?
Yes, buyers are still active. Pending and closed sales have both increased, showing continued demand. The difference is that buyers are taking more time, comparing options, and negotiating more than in previous years.
What does a balanced real estate market mean in Durango?
A balanced market means neither buyers nor sellers have a strong advantage. With inventory rising to around 4–5 months of supply, La Plata County is moving toward balance, though conditions still slightly favor sellers.
Why do home values vary so much within La Plata County?
La Plata County is made up of multiple micro-markets. Durango, Bayfield, and rural properties all behave differently depending on location, price point, and property type. These differences can significantly impact home values.
How can I find out what my home is worth in Durango?
The most accurate way is through a personalized market analysis based on your specific property, location, and current competition. A local evaluation provides far more insight than an automated estimate.
Let’s Build Your Strategy
Whether you’re planning to buy, sell, or simply want to understand where you stand, I’m here to help you navigate this market with clarity, confidence, and a strategy tailored to your goals.
📞 970-779-8055
📧 coral@coralsmithrealestate.com
Professional Disclaimer
The information provided reflects market data sourced in part from CREN®, Inc. for the period shown. While deemed reliable, it is not guaranteed and may not reflect all real estate activity. This content is intended for general informational purposes only and should not be considered legal, financial, or appraisal advice. For property-specific guidance, a personalized consultation is recommended.